

系统:WinAll 大小:27.0M
类型:专业制图 更新:2021-03-02 09:13
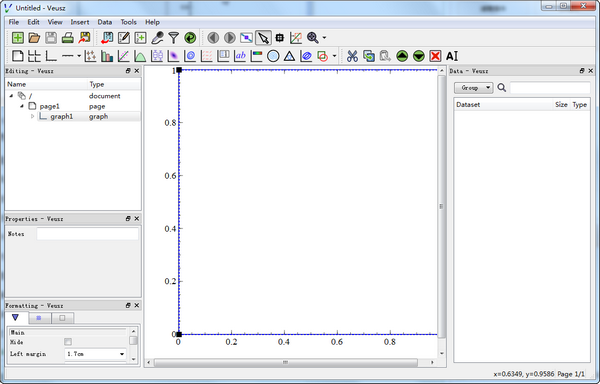
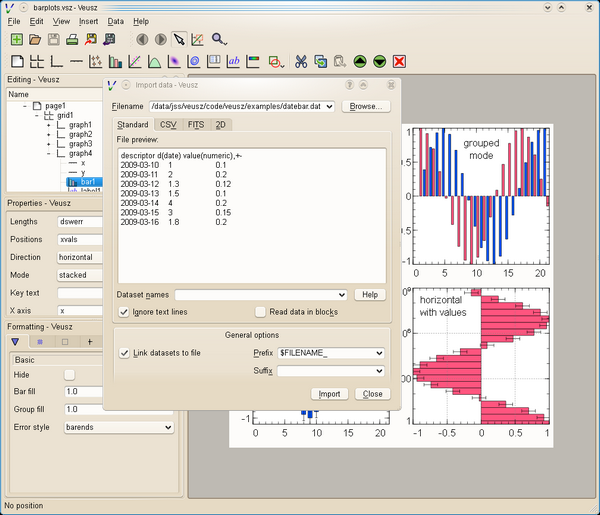
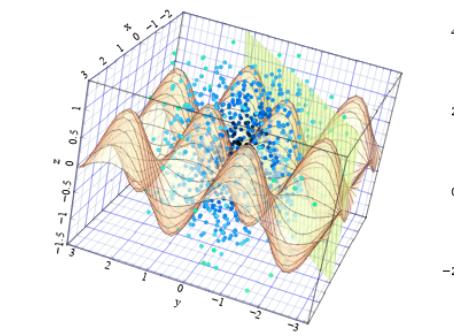
Veusz是一款专业的科研绘图软件,带有图形用户界面,旨在生成可发布的2D和3D图形,同时也有一些命令行接口以便直接在Python 程序中调用。
1. 免费体积小,安装包仅27M,比origin小的多
2. 常见图形都可以绘制
3. 可用作python中的绘图模块
打开导入数据对话框

导入数据,选择数据变量名称

对于含误差值的数据导入例子,下面给出官方例子,这里就不作翻译了。
Examples
x yx and y with no errors (2 columns for 2 datasets)
x,+-x with symmetric errors (2 columns for single dataset)
y + -y with asymmetric errors (3 columns for dataset)
x[1:5]+,-x_1 to x_5, each with asymmetric errors (15 columns in total)
x y +-x with no errors, y with symmetric errors (3 columns in total)
,x,y,-,+skip first column, x with no errors, y followed by negative then postive error bars
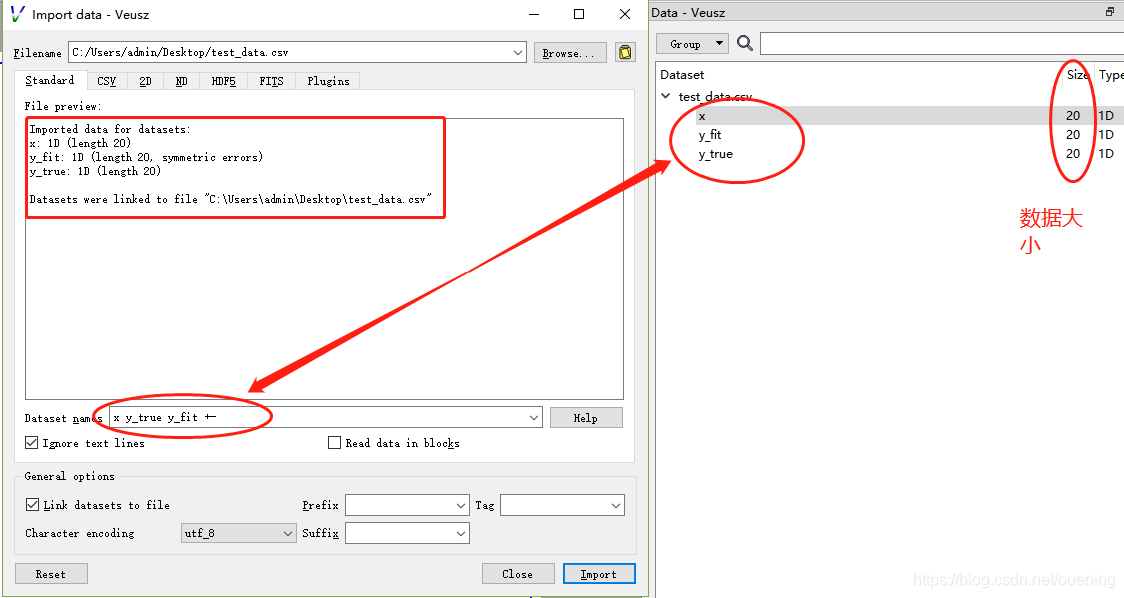
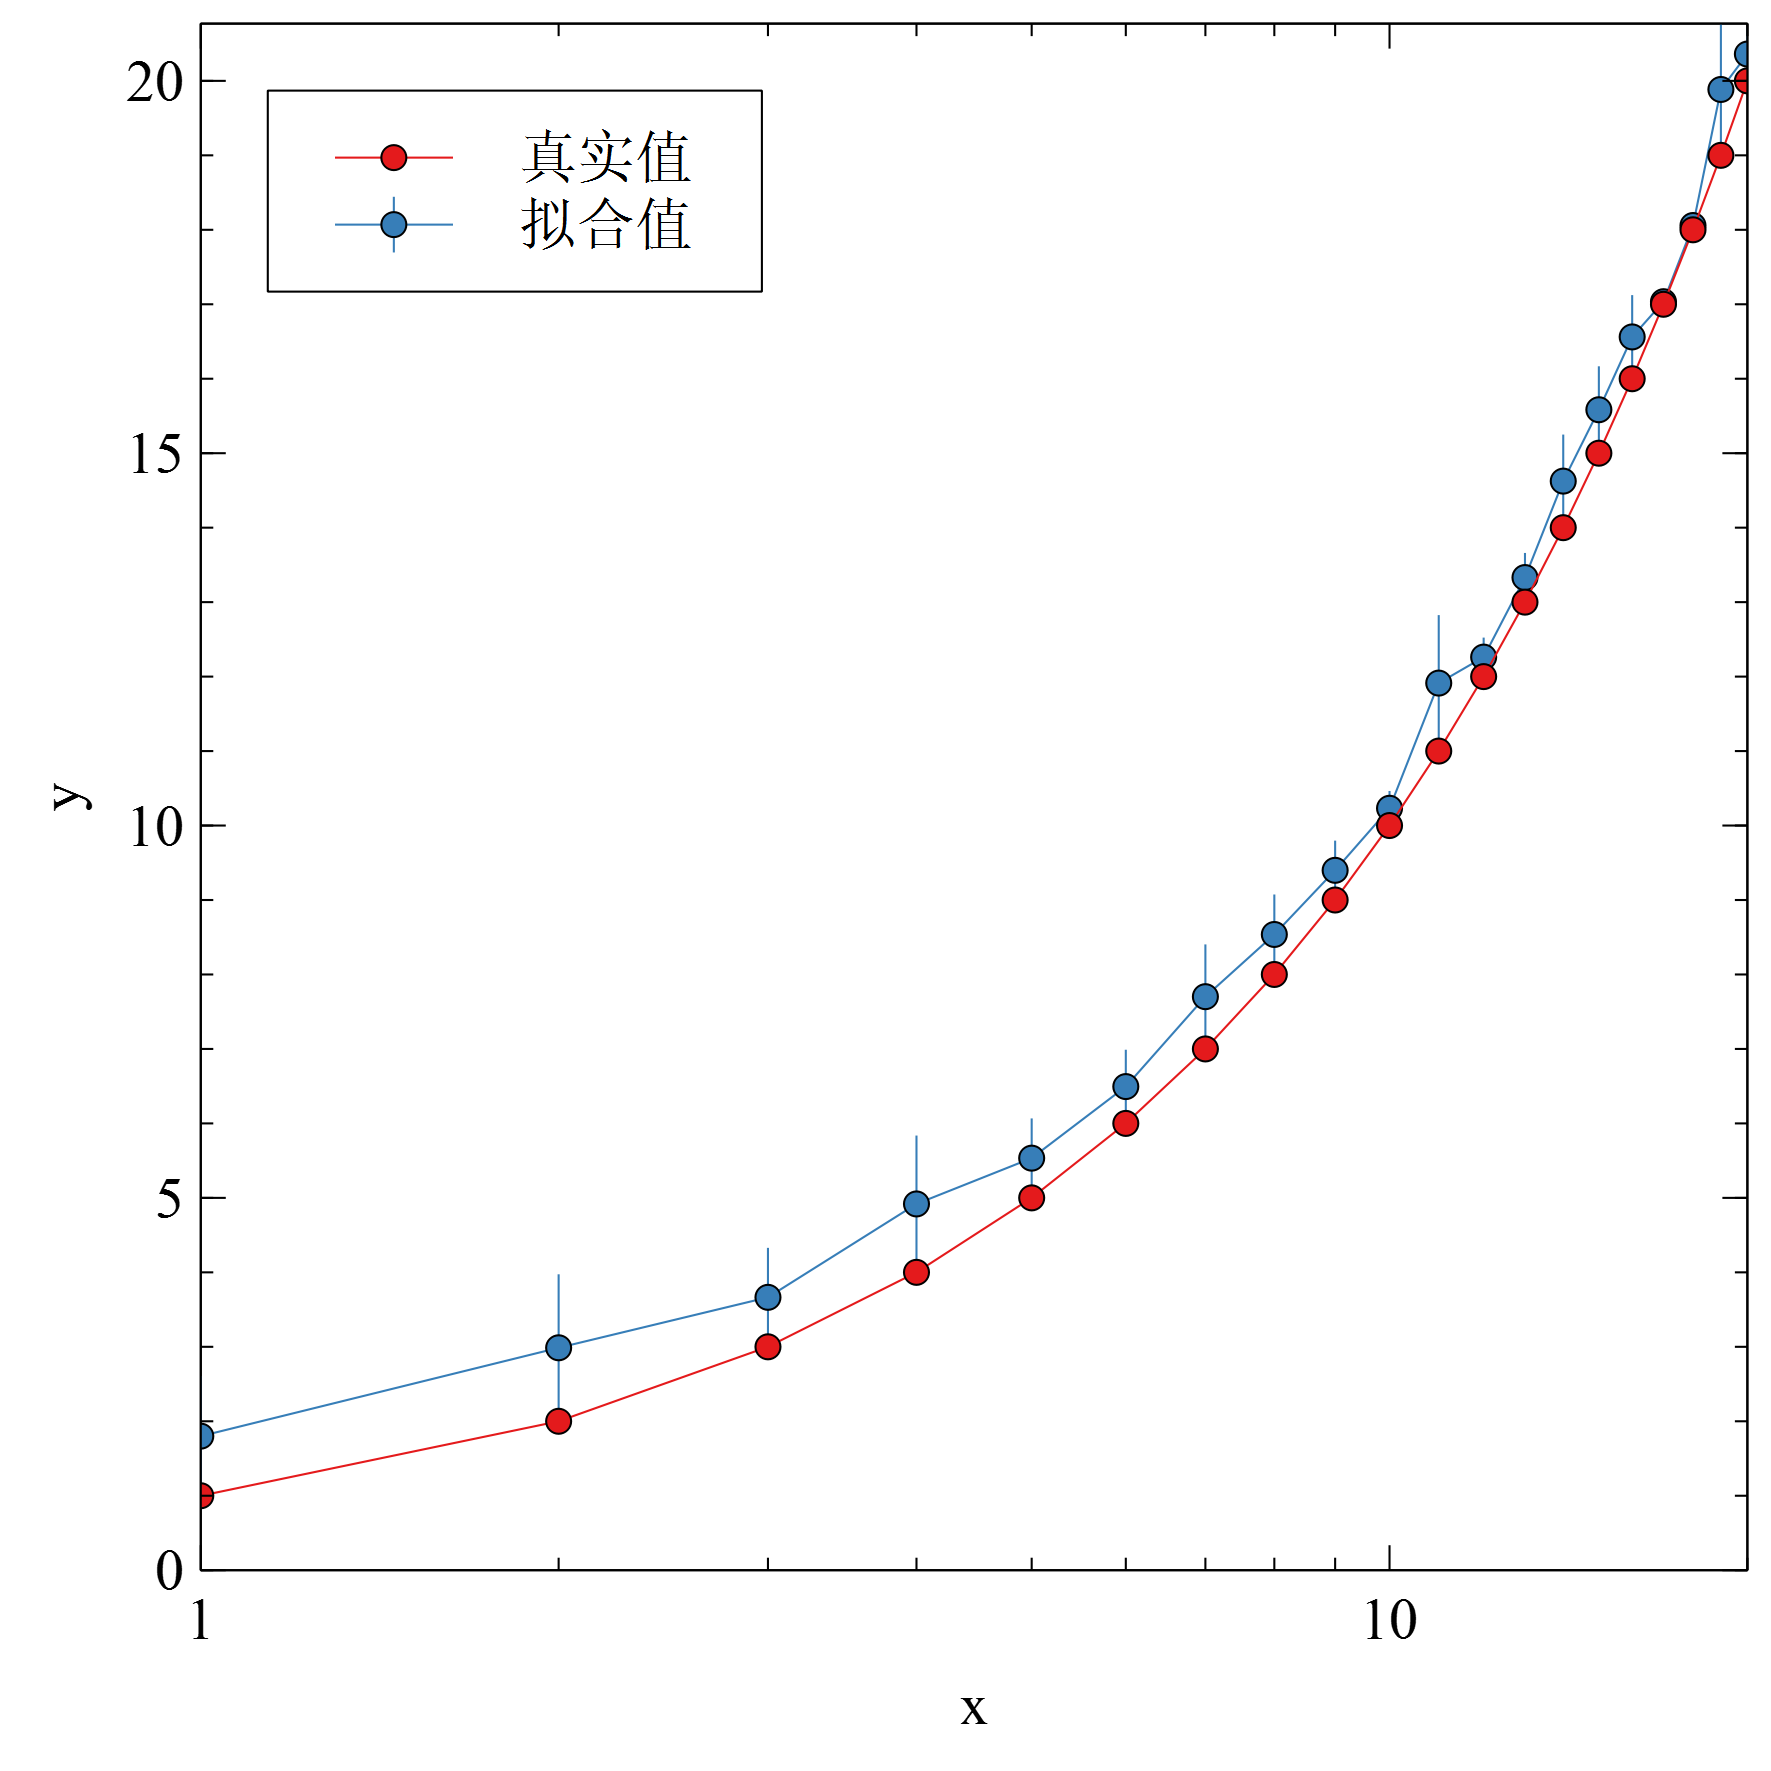
CSV数据
仍以前面的例子为例:
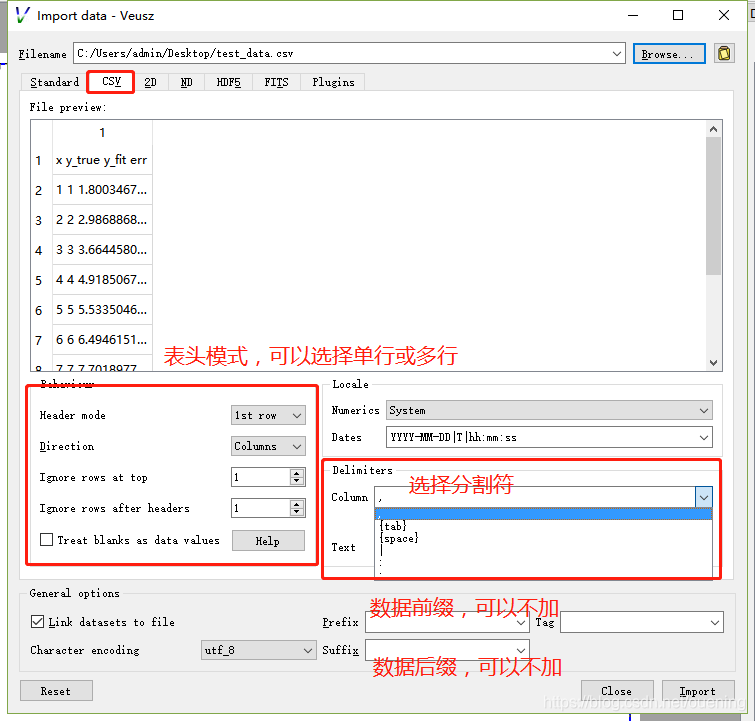
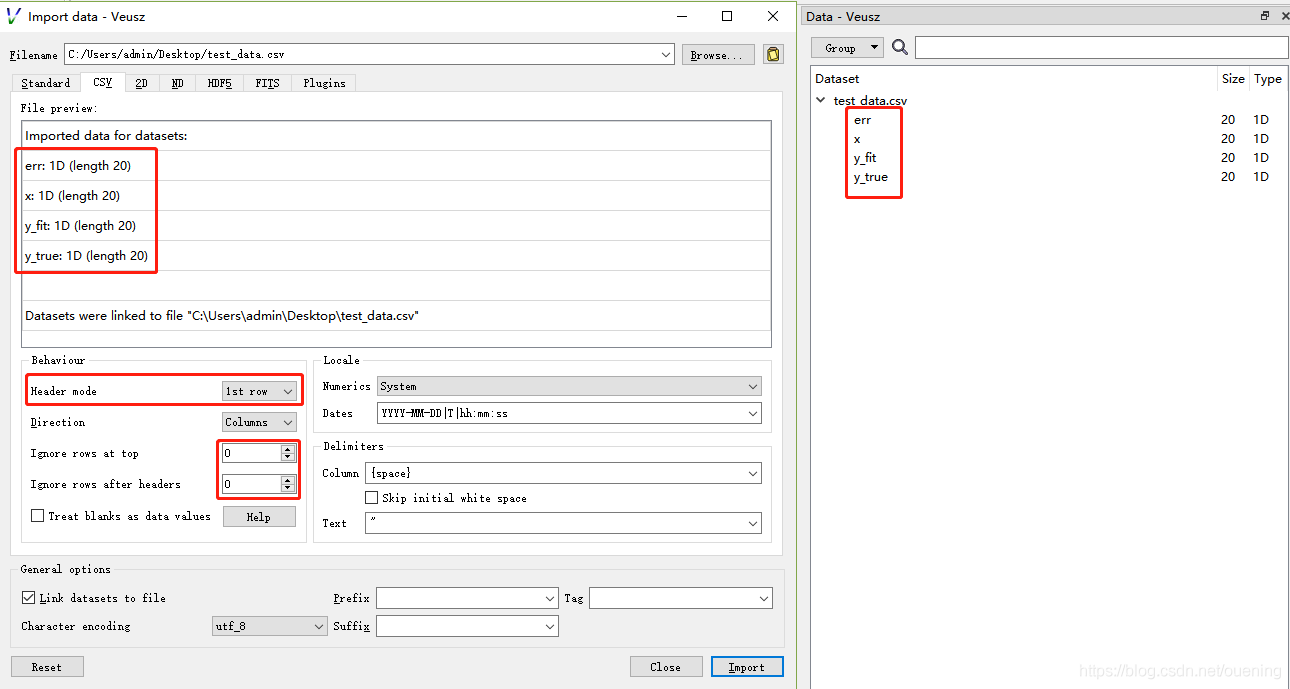
注意:导入CSV文件无法合并误差数据,误差值会单独成一列数据,为了方便可以按照前面方法处理带有误差的数据,即先在其他文本编辑器将数据处理为空格间隔。
应用信息